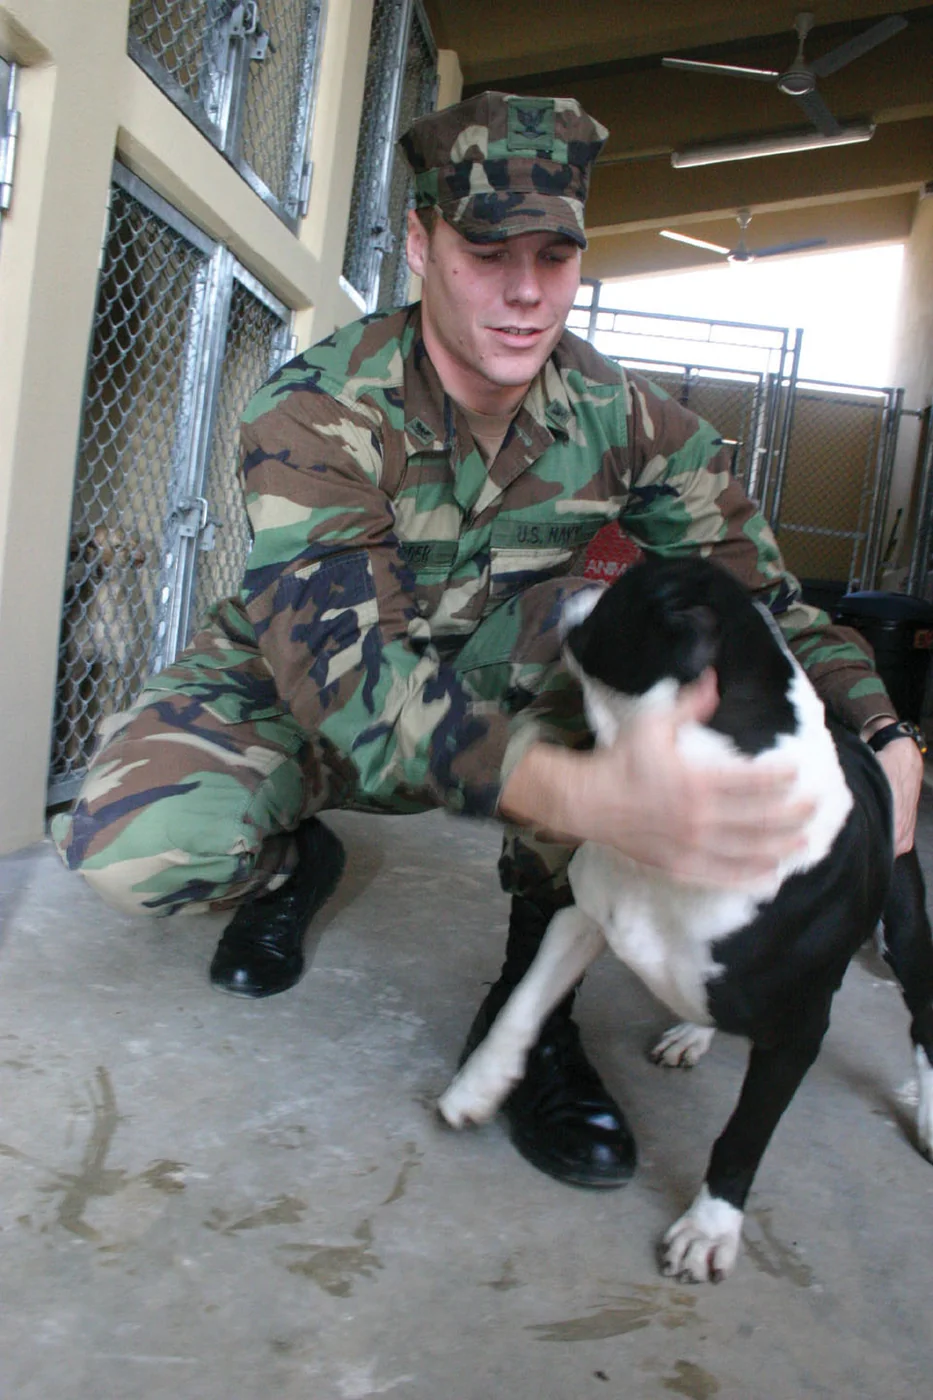
Photographer's Mate 3rd Class Gunnar Gorder socializes with a dog at Naval Air Station Sigonella's Stray Animal Facility, Sicily, 2003 U.S. Navy photo by Journalist 3rd Class Stephen P. Weaver. · Public domain · Web size optimized; source linked for the original.
Shelter reports arrive with figures on dogs admitted, puppies adopted, and live release rates near 90 percent. These invite celebration or worry. The real picture sits in how terms are defined, when events are counted, and what stays outside the totals. Grasping these mechanics helps readers see real welfare gains while noticing where a lone percentage might mislead. Shelters handle strays, owner surrenders, and medical cases within tight space and resources. A high headline rate can sit alongside crowded kennels or changing intake patterns. A lower rate may show a shelter accepting harder-to-place dogs instead of refusing them.
Core Terms in Shelter Reports
Intake counts every live dog or puppy entering through the door or brought in from the street. Categories matter. Stray holds give owners time to reclaim lost pets. Owner-requested intakes often involve animals with behavior issues or age-related conditions needing extra staff effort.
Outcomes show where the animals go after time in care. Live outcomes cover adoptions into families, returns to owners with paperwork, and transfers to partner rescues with foster networks or different adopter groups. Non-live outcomes include euthanasia for severe medical conditions or public safety risks, plus deaths despite veterinary care.
Reports also list animals still in care at the end of the period. These dogs may be healthy but waiting for a match or recovering from treatment. Monthly snapshots therefore show a slice of activity, not a full ledger. Trends across quarters or years give a clearer view than any single report.
The live release rate, sometimes called LRR or save rate, divides live outcomes by total outcomes for a period. Live outcomes add adoptions, returns to owners, and transfers. Total outcomes add those to euthanasias and deaths in care. A shelter with 850 dogs leaving alive and 50 not would show roughly 94 percent.
Many organizations follow frameworks from the Asilomar Accords or Shelter Animals Count to standardize counting. Some calculations exclude certain owner-requested euthanasias for irremediable suffering from the denominator.
Variations appear across shelters. Some compute against intake rather than outcomes. Others adjust for animals present at the start of the period. A 90 percent benchmark often marks no-kill status in community talk, though definitions differ slightly by group. The metric looks at outcomes among animals reaching a final disposition in the reporting window.
Limits of a Single High Rate
A sparkling live release rate can mask capacity issues or selection effects. Transferring many dogs elsewhere moves the challenge to receiving groups. Refusing hard cases to protect a percentage leaves those dogs without options, a choice not visible in the headline figure.
Length of stay provides a useful counterpoint. High release rates paired with dogs lingering for months can point to overcrowding that raises stress or disease risk. Improvements in live release often track rising adoptions more than drops in intake.
Timing quirks affect monthly figures. A litter admitted late in one month may not find homes until the next, so one period shows high intake while the following looks thin on outcomes. Owner-requested euthanasia for elderly dogs may count differently depending on the formula, making direct comparisons tricky. Seasonal litters or disasters can shift the mix of healthy or injured animals and change the rate.
Adıyaman Metropolitan Municipality Animal Shelter, 2024 Voice of America · Public domain. Web size optimized; original linked.
Layering Metrics for a Fuller View
Useful reading combines intake with outcomes to check whether a shelter keeps pace or builds a backlog. A rising live outcome rate with a growing number of dogs still in care may signal operation near or beyond comfortable limits, where noise and staff fatigue affect residents.
Return-to-owner percentages show community connections. Strong microchip and scanning programs speed family reunions. Transfers reveal partnerships, though heavy reliance can strain the wider network.
Community factors shape results. Areas with good spay-neuter access and low strays see fewer easily adoptable puppies and more seniors or dogs needing experienced homes. Reports that split data by age, breed, or intake type help spot whether adoption changes reflect shifts in the types of dogs present. Over years, declining euthanasia as a share of intake can signal progress in prevention and placement.
Using the Numbers to Support Welfare
With context, supporters can note real gains and advocate with care. When a report appears, look past the main rate to intake trends and length-of-stay details. Communities benefit when shelters stay open-admission and direct resources to the animals arriving.
A thoughtful 85 percent in a high-intake urban shelter may reflect harder work than a 95 percent in a low-volume suburb. Readers who understand the formulas and supporting data can back policies that reduce intake through accessible veterinary services while maintaining the safety net for dogs that still arrive.
Mississippi State University Shelter Medicine Program Prof. Philip Bushby, D.V.M., M.S., A.C.V.S. (USDA photo by Lance Cheung, 2012) USDAgov · Public domain. Web size optimized; original linked.
AI-assisted original writing. This feature was revised against source material and checked for unsupported claims. Follow the references below for evidence and its limits.


 Historical collection image